
Charles John
Data Analyst | SQL | Python | Power BI | Tableau
Based in Brisbane, Australia
Charles John
Data Analyst | SQL | Python | Power BI | Tableau
Based in Brisbane, Australia
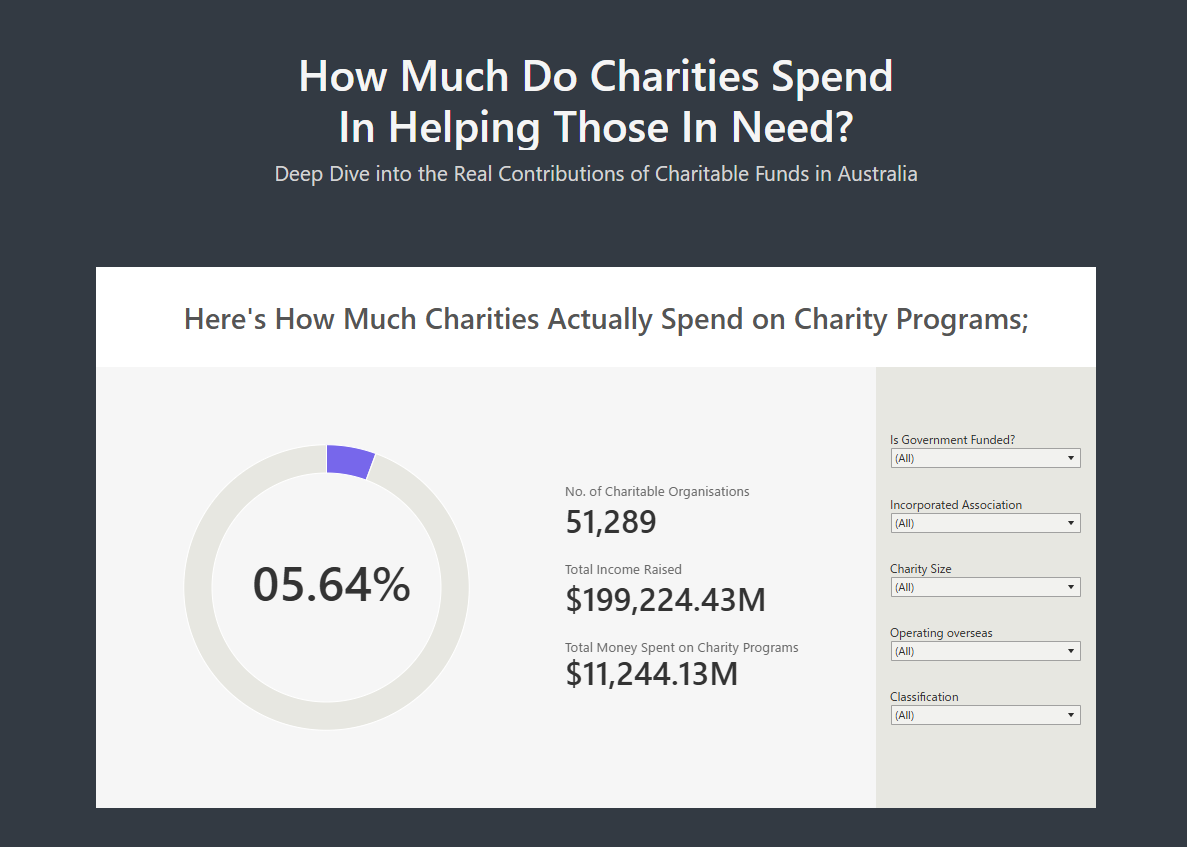
This Tableau dashboard provides an insightful analysis of the financial activities of Australian charities in 2022. It reveals that while many charities spend only a small portion of their income on actual charity work, there are organizations that allocate most of their funds effectively. The dashboard examines how spending varies across different demographics and proposes…
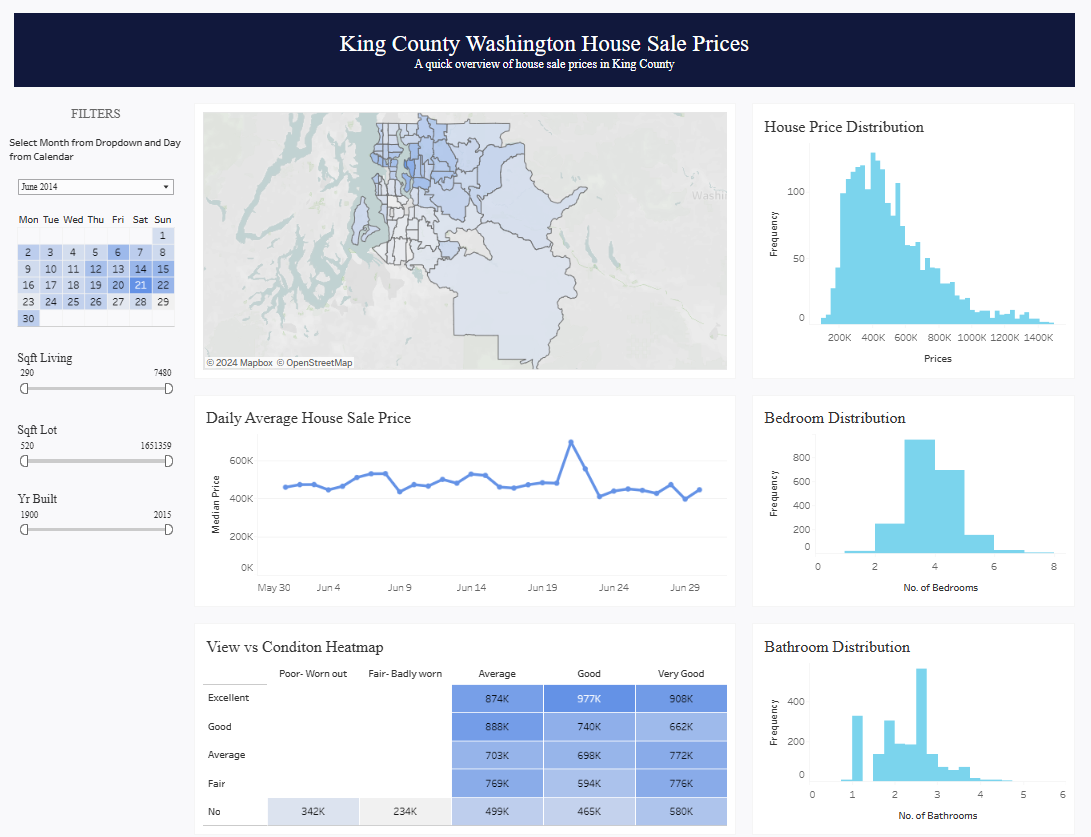
In this Tableau dashboard, I present a comprehensive analysis of the housing market in King County, Washington. By examining a rich dataset, I explore various aspects of house sales, including trends in sales prices, property types, and market dynamics. The analysis covers a diverse range of property characteristics such as square footage, number of bedrooms…

Click Here To View Interactive Dashboard In this Tableau dashboard, I delve into a comprehensive analysis of historical crash data on Australian roads spanning from 1989 to 2023. This extensive dataset encompasses a wealth of information, offering valuable insights into the patterns and trends of accidents over the years. The primary objective of this analysis…