
I completed this case study as part of my Google Data analytics certification. The tools used for this analysis are MySQL and Power BI.
Visualization
About the company
Bellabeat is a high-tech manufacturer of health-focused products for women. Bellabeat is a successful small company, but they have the potential to become a larger player in the global smart device market. Urška Sršen, cofounder and Chief Creative Officer of Bellabeat, believes that analyzing smart device fitness data could help unlock new growth opportunities for the company.
Business goal
1) Focus on a Bellabeat product and analyze smart device usage data in order to gain insight into how people are already using their smart devices.
2) Using this information make high-level recommendations for how these trends can inform Bellabeat marketing strategy
Data sources used:
The data set for this analysis was taken from Fitbit Dataset -This Kaggle dataset contains personal fitness tracker from thirty fitbit users. Thirty eligible Fitbit users consented to the submission of personal tracker data. It includes information about daily activity, steps, and sleep that can be used to explore users’ habits.
Determining Credibility Using ROCCC
Reliable?- Because the data only comes from 30 randomly chosen people and the population of people that use Fitbit is 111 million as of 2023 this is not a fair representation of the population. Not reliable.
Original?-this dataset was generated by respondents to a distributed survey via Amazon Mechanical Turk between 03/12/2016-05/12/2016. Not original.
Comprehensive?– there are some pieces of information needed that may be important when comparing fitness/health data including age and sex(especially since bellabeats audience is women). Not comprehensive.
Current?– No, data is from 2016.
Cited?- Yes, the data is cited.
I chose to use the following files from this dataset:
dailyactivity_merged.csvdailycalories_merged.csvdailyintensities_merged.csvdailysteps_merged.csvhourlycalories_merged.csvhourlyintensities_merged.csvhourlysteps_merged.csvsleepday_merged.csvweightloginfo_merged.csv
Data Cleaning
- Verified that Hourlycalories_merged and dailycalories_merged have consistent data using the code;
select Id, Date_in, sum(Calories) as daily_calories
from (SELECT Id, ActivityHour, SUBSTRING_INDEX(ActivityHour, ' ', 1) AS Date_in, Calories
From hourlycalories_merged) as new_table
group by Id, Date_in
Some slight changes in values were observed (+-3 calories), probably due to how tracking works. Also verified the consistency of data in the other tables using similar codes.
2. Verified the number of users in each data set and checked if they provided data throughout the duration. It is found that there are 33 users instead of 30, and most of them are inconsistent in using the fitness tracker. Also, the number of users vary for each data set.
Analysis
The analysis of the data was done using MySQL. The following were used to find how people use fitness tracking;
User Engagement
No of users vs Dates
select str_to_date(ActivityDate,'%m/%d/%Y') As Date, count(Id)
from dailyactivity_merged
group by ActivityDate
No of people who used sleep tracking
select count(distinct Id)
from sleepday_merged
No of people who used weighty loss tracking
select count(distinct Id)
from weightloginfo_merged
No of people who used Calorie/Step/Intensity Tracking
select count(distinct Id)
from dailycalories_merged
Average Number of days people tracked Calorie/Steps/Intensity
Select sum(Days)/33
from(select distinct Id, count(ActivityDay) as Days
from dailycalories_merged
group by Id) as new_table
Average Number of days people tracked Sleep
Select sum(Days)/24
from(select distinct Id, count(SleepDay) as Days
from sleepday_merged
group by Id) as new_table
Average Number of days people tracked Sleep
Select sum(Days)/8
from(select distinct Id, count(Date) as Days
from weightloginfo_merged
group by Id) as new_table
The No. of days the users wore the device full time and not
SELECT
COUNT(CASE WHEN total_minutes = 1440 THEN 1 END) AS count_equal_1440,
COUNT(CASE WHEN total_minutes < 1440 THEN 1 END) AS count_below_1440
from dailyintensities_merged
How long do users wear teh device (avg time)
SELECT sum(total_minutes)/count(ActivityDay) as Avg_wearing_time
from dailyintensities_merged
Average wear time vs Day of week
SELECT
Dayname(str_to_date(ActivityDay, '%m/%d/%Y')) as Dayname,
avg(total_minutes) as Avg_Total_Minutes
from dailyintensities_merged
group by Dayname
Time patterns
Avg. Sleep time vs Days of week
SELECT
Dayname(str_to_date(SleepDay, '%m/%d/%Y')) as Dayname,
avg(TotalMinutesAsleep) as Avg_Total_Minutes_Asleep
from sleepday_merged
group by Dayname
Avg Steps, Avg Calories by day of the week
SELECT
Dayname(str_to_date(ActivityDate, '%m/%d/%Y')) as Dayname,
avg(TotalSteps) as Avg_Steps,
avg(Calories) as Avg_Calories
from dailyactivity_merged
group by Dayname
Avg Steps, Avg Calories by Hour
SELECT avg(hourlysteps_merged.StepTotal) as Avg_Steps, avg(hourlycalories_merged.Calories) as Avg_Calories, hourlycalories_merged.Hour_in
from hourlycalories_merged
join hourlysteps_merged on hourlycalories_merged.ActivityHour = hourlysteps_merged.ActivityHour AND hourlycalories_merged.Id = hourlysteps_merged.Id
group by hourlycalories_merged.Hour_in
Health and wellness metrics
Distance vs Time
SELECT ActivityDate, avg(VeryActiveDistance), avg(ModeratelyActiveDistance), avg(LightActiveDistance), avg(VeryActiveMinutes), avg(FairlyActiveMinutes), avg(LightlyActiveMinutes)
from dailyactivity_merged
group by ActivityDate
Activity Distribution
SELECT avg(VeryActiveMinutes), avg(FairlyActiveMinutes), avg(LightlyActiveMinutes), avg(SedentaryMinutes)
from dailyactivity_merged
Time Asleep vs Time on bed
SELECT str_to_date(SleepDay, '%m/%d/%Y') as Dates, avg(TotalMinutesAsleep), avg(TotalTimeInBed)
from sleepday_merged
group by SleepDay order by Dates
Trends Observed
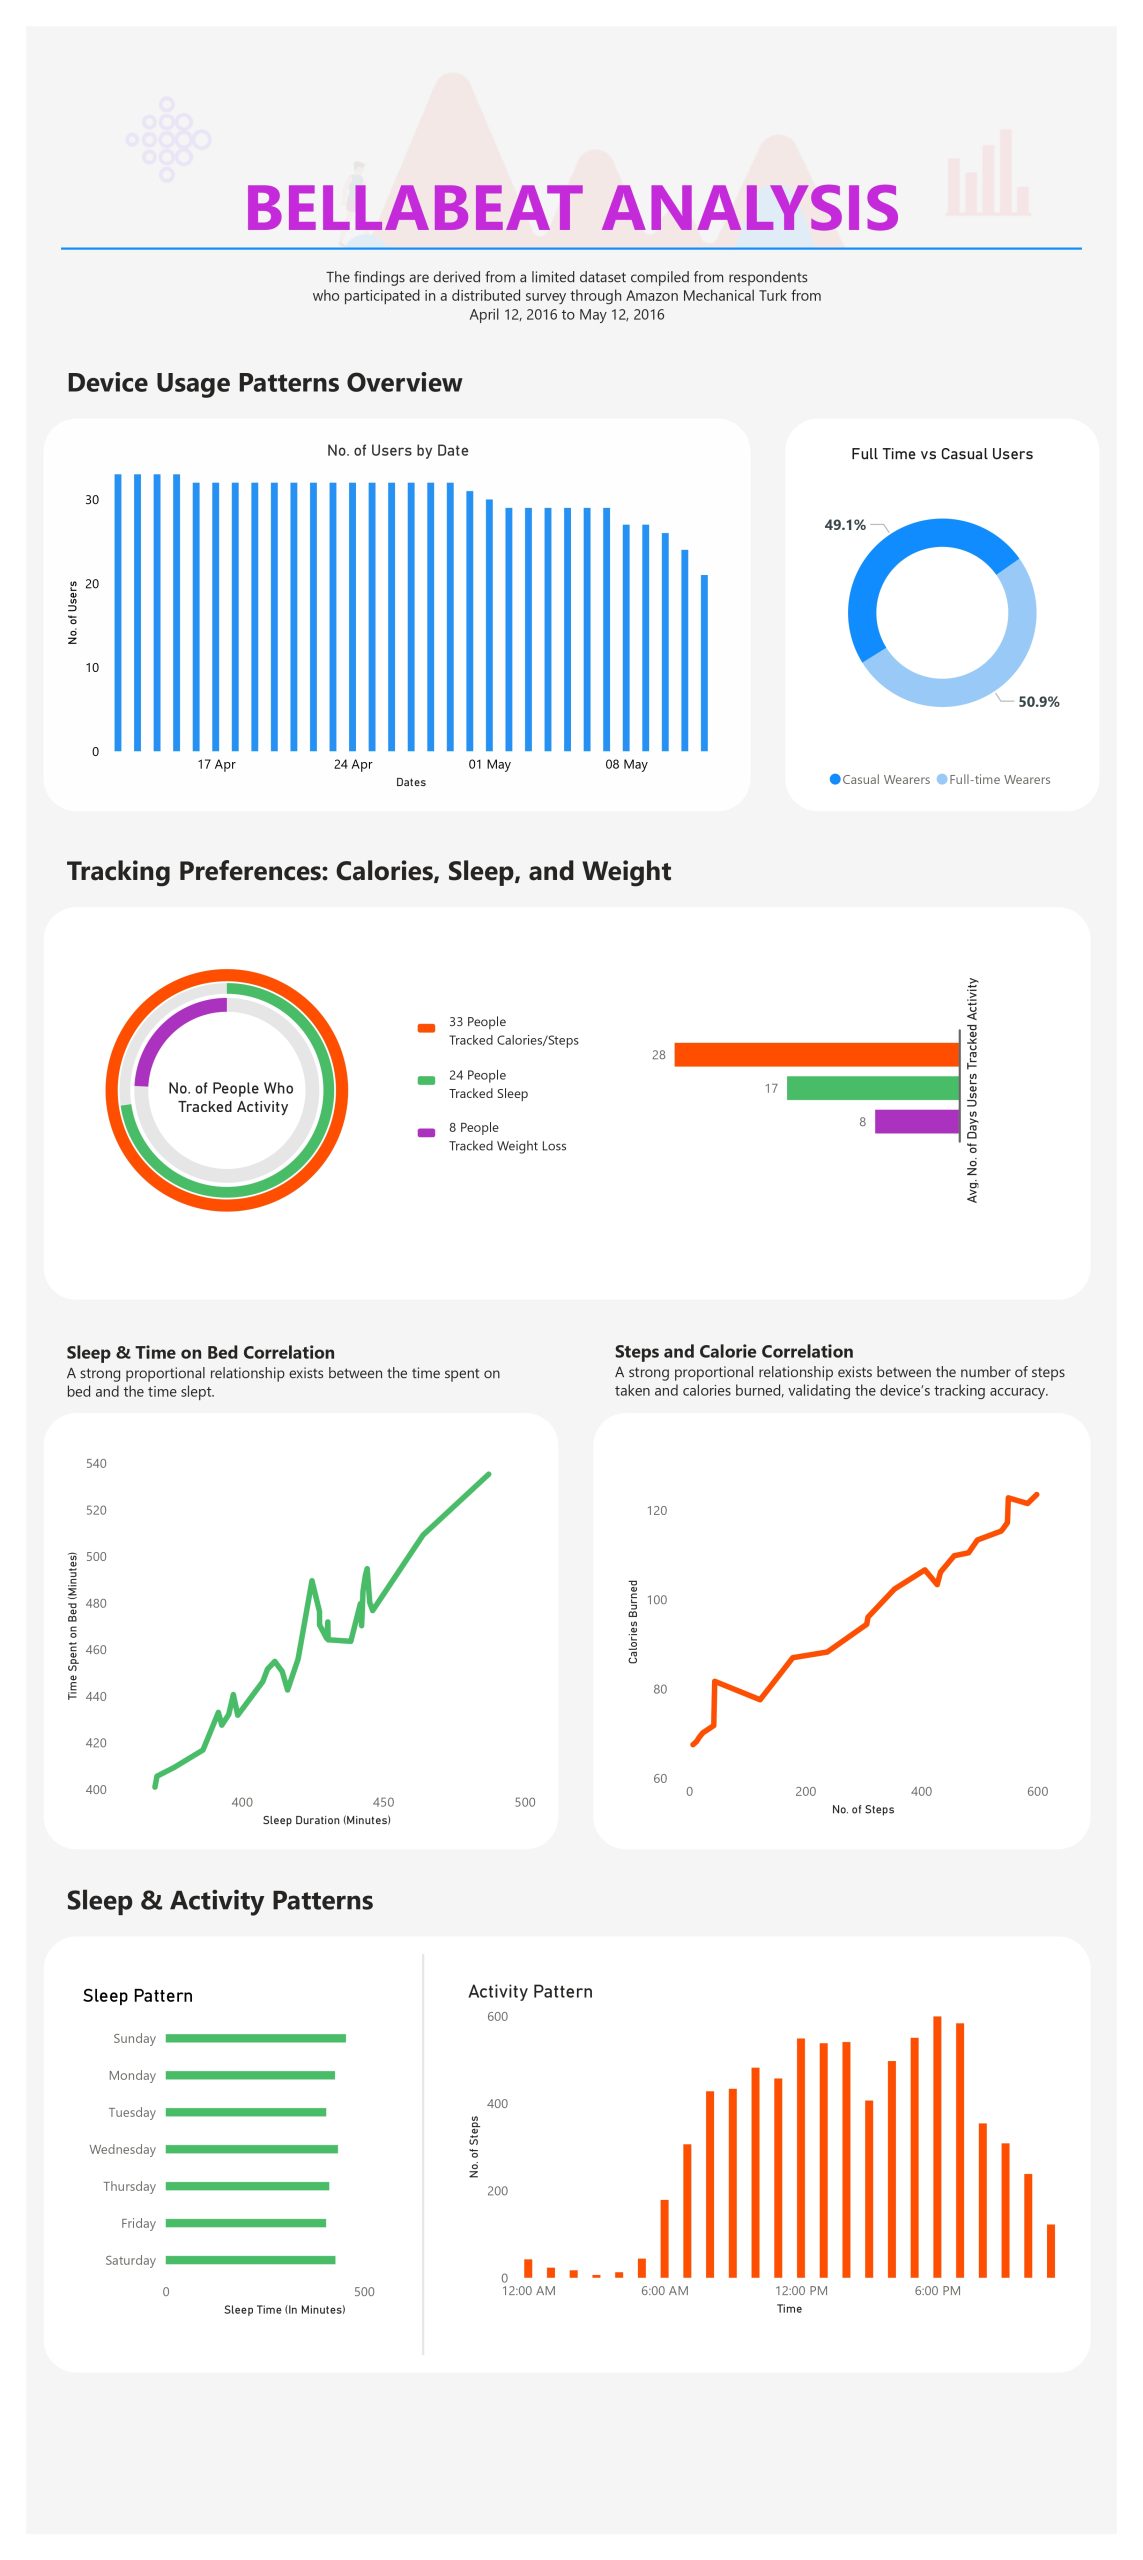
- User Drop-Off: The number of active users declined from 33 to 21 within a month, indicating potential issues with user retention or engagement.
- Weight Loss Tracking: Only 8 users actively tracked their weight loss, suggesting an opportunity to enhance the promotion of this feature.
- Casual Usage: Approximately 50% of wearers are casual users, not utilizing the tracker consistently throughout the day.
- Sleep Tracking: A relatively low number of users, 24, engaged with the sleep tracking feature, highlighting a potential gap in awareness or perceived value.
- Activity Level Tracking: The majority of users primarily use the tracker for monitoring activity levels, such as steps, calories burned, and exercise intensity.
- Steps and Calorie Correlation: A strong proportional relationship exists between the number of steps taken and calories burned, validating the device’s tracking accuracy.
- Weekly Usage Patterns: Mondays and Thursdays show the highest device usage, whereas Thursdays are the lowest. Peak activity times are between 8 am and 7 pm.
- Sleep Patterns: Users tend to sleep more on Sundays, Wednesdays, and Saturdays. Increased time spent in bed correlates with longer sleep durations.
Recommendations
Here are tailored marketing strategies based on each insight from my analysis:
- User Drop-Off:
- Re-engagement Campaign: Develop a personalized re-engagement campaign targeting users who have reduced their usage. Offer incentives like exclusive content, discounts on premium features, or limited-time challenges to encourage them to return to regular use.
- Weight Loss Tracking:
- Feature Promotion: Create a targeted campaign to promote the weight loss tracking feature, showcasing success stories and offering guidance on setting and achieving weight loss goals. Utilize social media ads and email newsletters to reach potential and existing users interested in weight management.
- Casual Usage:
- Daily Engagement Initiatives: Introduce daily challenges, reminders, or motivational content through push notifications to encourage casual users to wear the device more consistently. Gamify the experience by offering rewards or badges for consecutive days of use.
- Sleep Tracking:
- Educational Content Campaign: Launch a series of blog posts, videos, and infographics on the importance of sleep health and how the Bellabeat tracker can improve sleep quality. Collaborate with sleep experts for webinars or Q&A sessions to boost credibility.
- Activity Level Tracking:
- Activity Challenges and Community Building: Create community-based challenges focusing on activity levels, where users can share their progress, compete with friends, and earn rewards. Highlight user-generated content in marketing materials to build a sense of community.
- Steps and Calorie Correlation:
- Integrated Health Campaign: Develop a campaign demonstrating the accuracy and benefits of Bellabeat in helping users understand their fitness data. Use case studies and real-life examples to illustrate how tracking steps and calories can lead to better health outcomes.
- Weekly Usage Patterns:
- Weekday Engagement Strategy: Schedule specific promotions or feature highlights on Mondays and Thursdays to capitalize on high usage days. Offer tips and tricks on optimizing device use, particularly on days with lower activity.
- Sleep Patterns:
- Weekend Sleep Campaign: Emphasize the importance of rest and recovery on Sundays, Wednesdays, and Saturdays with campaigns encouraging better sleep practices. Offer discounts on related accessories or apps during these days to encourage users to focus on their sleep health.