
Scenario
(Note: Cyclistic is a fictional company. Lily Moreno and the marketing team are fictional characters.)
Cyclistic is a bike sharing service that launched in 2016. It boasts a fleet of 5,824 bicycles that are Geo tracked and locked into a network of 692 stations within the city of Chicago. The service allows users to unlock different types of bicycles at any given station and return the bicycle to a station closest to their destination within the system. The service has two types of customers, casual riders and Cyclistic members. Casual riders are customers that purchase single-ride or full day passes and customers that purchase annual memberships are Cyclistic members. Our director of marketing and my manager Lily Moreno believes the company’s future success depends on increasing the number of annual memberships. Therefore, she has tasked myself and fellow marketing analytics team to investigate Cyclistic’s geotracked bike data that is logged every time a customer unlocks, rides, and returns a bicycle. Using the data logged from December 2020 to February 2021, our goal is to discover how casual riders and annual members use Cyclistic bikes differently in order to gain insight on how to design a marketing strategy to convert casual riders into annual members. To execute Moreno’s request, I’ll follow six steps to complete it: ask, prepare, process, analyze, share, and act.
Key stakeholders
- Cyclistic executive team.
- Lily Moreno (The director of marketing and your manager)
- Cyclistic marketing analytics team
Ask (Business Goals)
Using the data available, our director of marketing has requested I answer the following question:
- How do annual members and casual riders use Cyclistic bikes differently?
- What are the insights gained on how to design a marketing strategy to convert casual riders into annual members.
In order to find out how annual members and casual riders differ, I asked the following questions;
- How the number of trips compare between the two categories of riders?
- What percentage of trips do they contribute?
- What is the average trip duration for each category of riders?
- What are the peak trip hours for the riders?
- What is the expected number of trips by casual riders per 1000 trips by annual members. Is there any time in the day where the expectations are disrupted?
- What are the popular start stations for Annual Members?
- What are the popular start stations for casual riders?
- Are there any stations where casual members make more trips than annual members (An overview of the data clearly showed that trips by annual members are significantly higher than that of casual members. So I am exploring exceptions to maximize the conversions through the marketing campaign)
- What days of the week are popular among annual and casual riders?
Answering these questions will give more insights into the behavioral pattern of casual riders and annual members which can be used to explore ways to efficiently target casual riders and encourage them to upgrade to annual plans. This will help the marketing team formulate an efficient marketing strategy to maximize conversions.
Prepare
Data Generation:
This data was provided by Coursera as part of Google Data Analyst Certificate. The data is about a fictional company, the datasets have been made available by Motivate International under this license.
The dataset covered three months of data from the fictional company Cyclistic.
Data Format
The data was downloaded as a csv file and was opened in MS Excel. The data had the following columns;
- trip_id
- start_time
- end_time
- bikeid
- tripduration
- from_station_id
- from_station_name
- to_station_id
- to_station_name
- usertype
- gender
- birthyear
Credibility Issues
The data has a significant number of missing values under the columns ‘Gender’, and ‘Birth Year’. The number of missing values are so high that the parameters ‘Gender’ and ‘Birth Year’ cannot be used to reach any meaningful conclusions.
Outliers
A few of the trip durations were very high, sometimes lasting a few days, which were observed for a number of trips. This could be due to the delay in returning the ride to the stations, or taking the ride with stops in between. Therefore, it was concluded that the values are true. Further investigation was made whether these values will skew the result, and found that unlikely. To do this, I averaged the trip lengths under 5 hours and compared it to the original average trip length. While the values differed I still reached the same conclusion that the trip lengths are significantly higher for casual riders.
Data Protection
An original copy of the data was stored in a folder in my computer. A copy of it was used to perform the next steps of the data analysis process.
Process
The dataset was processed using MS Excel software. The below steps were followed in the data cleaning process;
- Checked for missing data. No missing data was found in columns other than ‘Gender’ and ‘Birth Year’
- Checked how significant the missing data is in the ‘Gender’ and ‘Birth Year’ columns by;
- The blank cells in the columns were replaced by the value “Not Given”
- Used a pivot table to count and compare the missing values. The pivot table was categorised into Annual members and Casual riders. From this, it was observed that the category Casual riders missed over 74% of values which made it impossible to make any meaningful conclusions in teh analysis.
- Checked for duplicated in the ‘trip_id’ column to make sure the data doesn’t have duplicates.
- Confirmed that the values in ‘trip_duration’ are correct by subtracting the corresponding values of ‘star_time’ and ‘end_time’ into a new column. These values were checked against the original using the formula (=E2=M2) and ‘sort and filter’ option.
- Created a new column ‘Trip duration in minutes’ for easy understanding of trip duration.
- Created a column ‘Start_Time_Hours’ using the formula (=TEXT(B2, “hh:mm”)) to list the starting ‘time’ of a trip.
- Created a column ‘Start_Time_value’ to convert the time into Excel hours using the formula (=TIMEVALUE(N2))
- Created a column ‘Time_Range’ which split the time into 0-4, 4-8, 8-12, 12-16, 16-20 and 20-24.This was done using the formula =IF(O6<0.1666666,”0 to 4″,IF(AND(O6>0.1666666,O6<0.333333),”4 to 8″,IF(AND(O6>0.333333,O6<0.5),”8 to 12″,IF(AND(O6>0.5,O6<0.6666666),”12 to 16″,IF(AND(O6>0.666666,O6<0.8333333),”16 to 20″, “20 to 24”)))))
- Created a column ‘Day_Of_Week’ to list days from the ‘start_time’ column. This was done using the formula (=TEXT(B15,”ddd”))
Analysis
The data analysis was done using MS Excel.
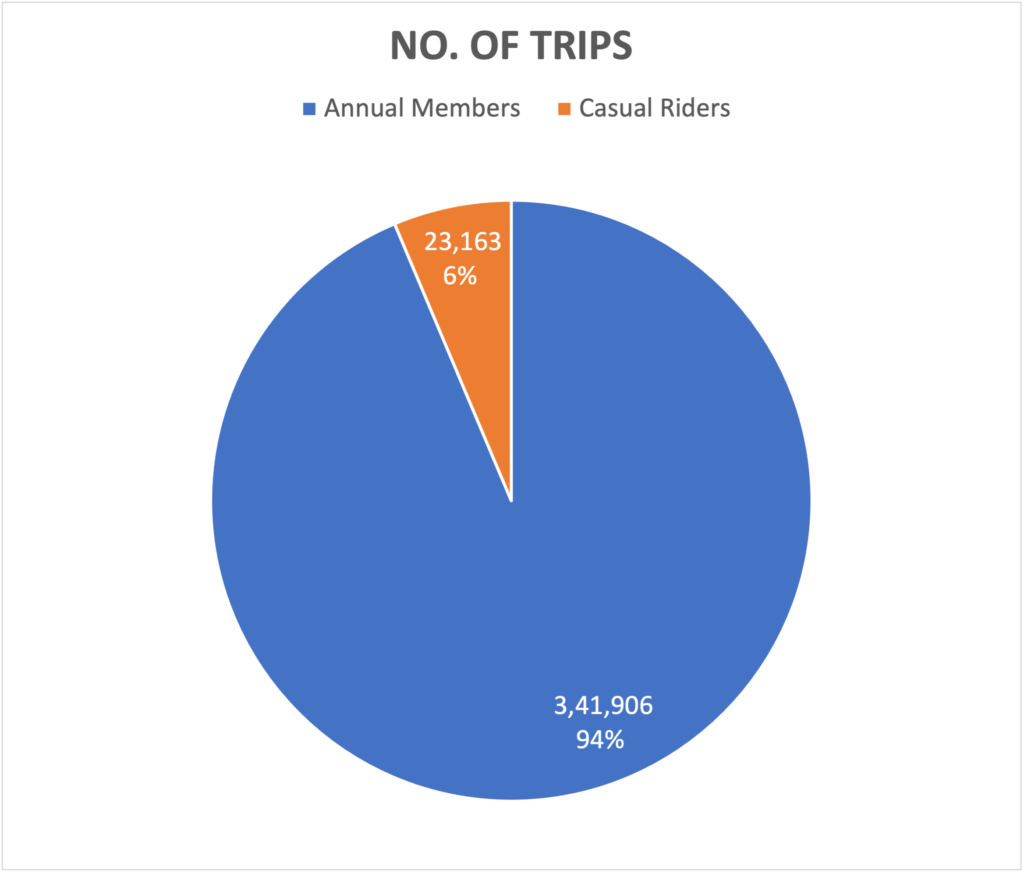
No. Of trips:
Using a pivot table I calculated the total number of trips taken by Annual Members and Casual Riders.
I also calculated the number of trips by casual riders per 1000 trips by annual members using the formula (casual riders/annual members)x1000 to use as a benchmark when necessary.
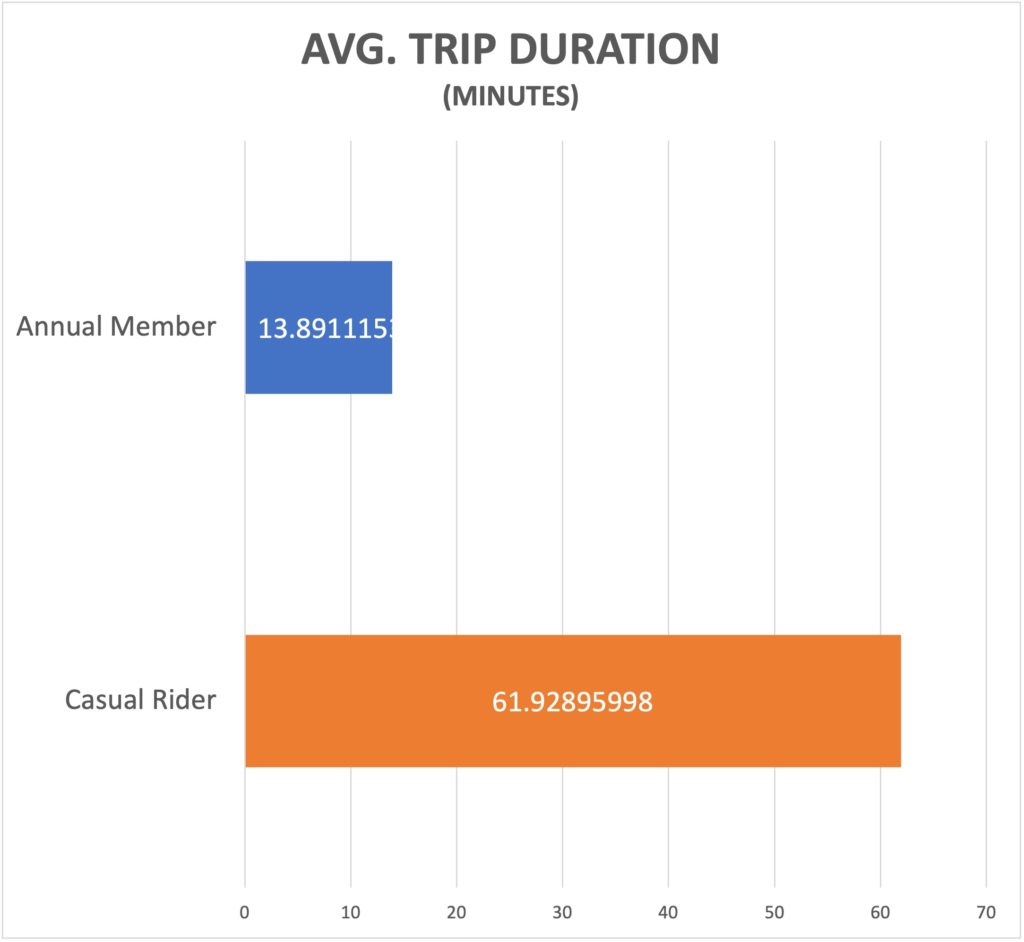
Trip duration
Using the pivot table I created a comparison of the trip duration by user type. The average trip duration was calculated for each user type.
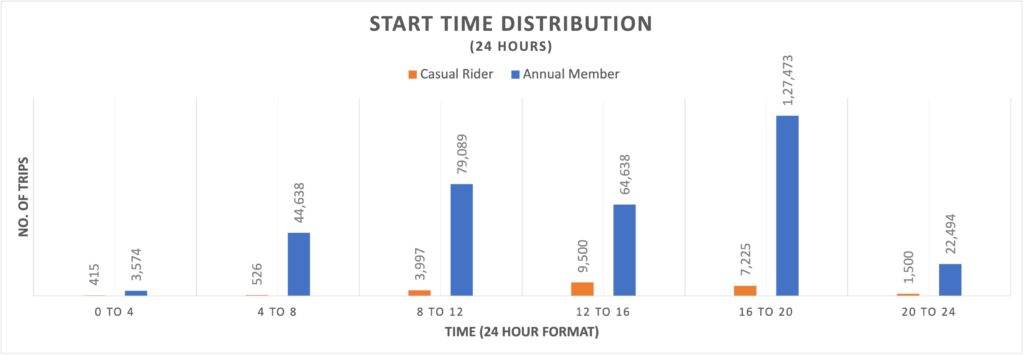
Start time distribution
The start times of trips were categorized into 0-4, 4-8, 8-12, 12-16, 16-20 and 20-24. The number of trips started by each user type within these time ranges were calculated.
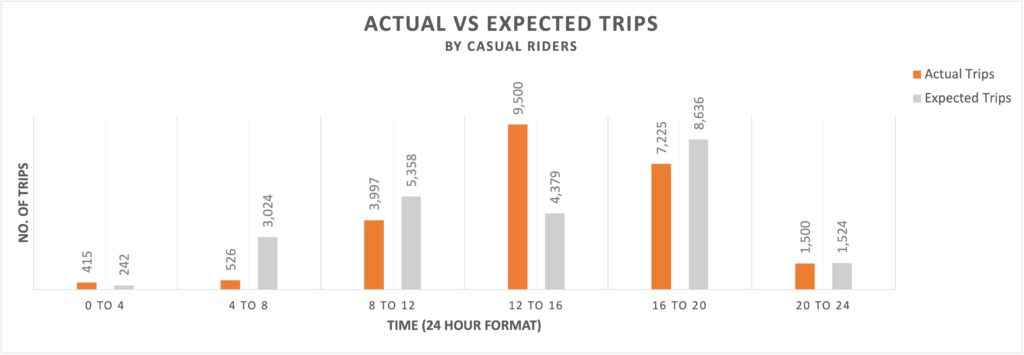
Actual vs expected trip times for casual riders
The number of trips by casual riders per 1000 trips by annual members were calculated for each of the above time ranges and compared against the bench mark previously created.
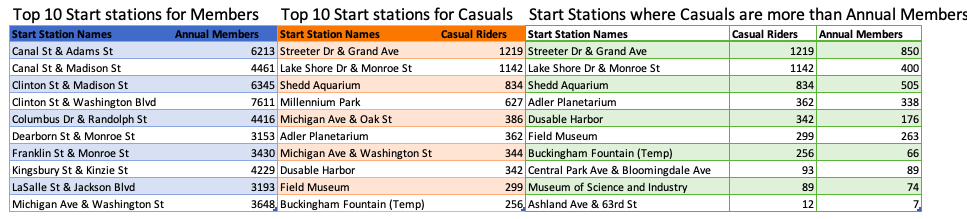
Top start stations
The top 10 stations were the trips started for each user type were listed.
Start Stations where Casuals are more than Annual Members
Since the number of trips by annual members are significantly more, I listed some exceptions; the start stations where trips by casual riders more than annual members.
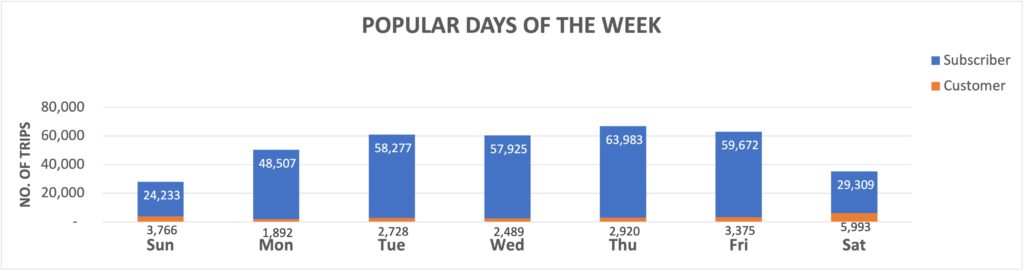
Popular days of the week
A daily breakdown of the number of trips made by both user types was made to find out which days are popular.
Visualizations
Insights
Given below are the findings from my analysis
- A comparison of number of trips show that Annual members do considerably more trips than Casual riders.
- A comparison of average trip durations shows that Casual riders ride almost 400% longer than Annual members.
- A comparison of start time of the two user types shows that most Annual members travel between hours 16 to 20 whereas most Casual riders travel between the time ranges 12 to 16 and 16 to 20.
- The below chart shows that the trips by Casual riders in the time range 12 to 16 is almost twice the expected number of trips.
- The tables below shows the popular start stations by both user types. Also, the last table shows the start stations where the number of trips by casual riders exceed that of Annual members. These are exceptions since generally the no. of trips by Annual members are significantly higher.
- From the table below we can draw the conclusion that Thursdays followed by Tuesdays and Fridays are most popular for Annual Members whereas Saturdays and Sundays are when most Casual riders opt to ride.
Recommendations
My analysis shows that Casual users use the bikes mostly on weekends while Annual Members use them during weekdays. Looking at time peek hours, it is easy to conclude that Annual Members are using this service for work related commuting.
Also, some stations are more popular for Casual riders than others.
Based on these data, my recommendations to target casual riders are;
- Longer-Trip Packages:
- Introduce annual membership plans with additional benefits, such as longer free trip durations, to attract Casual riders since they tend to ride longer distances.
- Time-Specific Promotions:
- Create time-specific promotions targeting Casual riders during the time ranges when they are most active (12 to 16) to encourage them to become Annual members.
- Communication on Benefits:
- Clearly communicate the benefits of annual membership, including more trips, cost savings, and additional features, to showcase the value proposition.
- Weekend Specials:
- Design weekend-specific promotions for Saturdays and Sundays to appeal to Casual riders who prefer weekend rides. Highlight the benefits of annual memberships during weekends.
- Exclusive Start Station Access:
- Offer exclusive access or benefits, such as priority access or special promotions, at popular start stations to Casual riders encouraging them to make the switch.
- Feedback and Improvement:
- Collect feedback from Casual riders to understand any concerns or barriers to conversion. Use this feedback to improve the annual membership offering and address specific user needs.
- Customized Membership Plans:
- Explore the possibility of introducing flexible or tiered annual membership plans to cater to different riding preferences and budgets.
- Engagement Initiatives:
- Run engagement initiatives, such as challenges or rewards programs, specifically designed for Casual riders to encourage consistent usage and make the transition to an annual plan more appealing.